
Blog · blog
Which Football Odds Analysis Tools Are Worth Using?
Editorial Team · 21 November 2026 · 6 min read
Last Updated: November 21, 2026
Quick Summary
The top football odds analysis tools fall into five categories: odds comparison sites, model probability publishers, expected-goals models, and similar services that convert bookmaker prices into implied probabilities. Our pick for transparency is PunditRival, which freezes every probability 36 to 1 hours before kick-off and SHA-256 hashes it, so nothing can be edited after the fact.
- Implied probability is 1 divided by the decimal odds, so odds of 2.50 imply a 40% chance.
- Add all three 1X2 outcomes and the excess above 100% is the bookmaker's margin.
- Our 1X2 log loss over a 10,930-match walk-forward test was 0.9866 against 0.9628 for Pinnacle's closing line.
- A record showing only winning calls is marketing, not evidence, so check losing calls sit alongside wins.
- A 30% forecast should land about 30% of the time, because calibration tells the truth where hit rate flatters.
Table of Contents
- What a Football Odds Analysis Tool Actually Does
- The Top 5 Football Odds Analysis Tools, Compared
- How to Calculate Implied Probability from Odds
- Frequently Asked Questions
What a Football Odds Analysis Tool Actually Does
A football odds analysis tool converts bookmaker prices into implied probabilities and compares them with a model's own estimate, so you can see where the two disagree. At PunditRival, we publish model probabilities and fair odds free, timestamped before kick-off and graded publicly afterwards, losing calls included.
The honest starting point: our 1X2 log loss over a 10,930-match walk-forward test was 0.9866, against 0.9628 for Pinnacle's closing line. The sharpest market is more accurate than our model, and we say so. Read the per-league breakdown in our AI vs bookmakers study and the research methods behind it.
statistical theory of optimal decision-making in sports betting, tested on over 5,000 NFL matches
A tool's job is not to pick winners. It is to price matches consistently and show its working.
The Top 5 Football Odds Analysis Tools, Compared
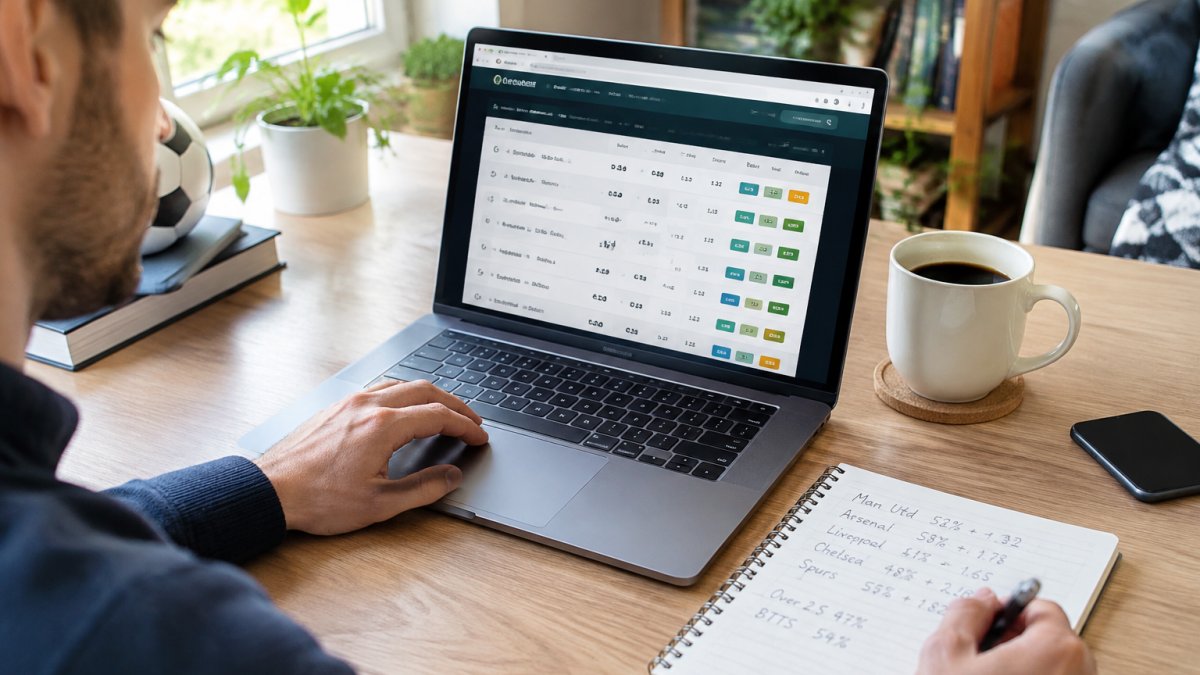
Five categories cover almost everything on the market:
| Tool type | What it does | Best for | Main weakness |
|---|---|---|---|
| Odds comparison sites | Show best available price across bookmakers | Price shoppers | No probability estimate |
| Model probability publishers | Publish fair odds and graded records | Calibration checks | Coverage limited to major leagues |
| Expected-goals models | Rate attack and defence from shot data | Tactical analysis | Needs interpretation |
Our pick for transparency is PunditRival, because every probability is frozen 36 to 1 hours before kick-off and SHA-256 hashed, so nothing can be edited after the fact. The stats centre carries live tables, form and a prediction-by-prediction accuracy record across nine European leagues. For the full numbers and best odds, VIP membership opens everything up.
FootyMetrics comparison of football statistics websites
A record that shows only winning calls is marketing, not evidence. Check that losing calls sit alongside the wins.
How to Calculate Implied Probability from Odds
Implied probability is 1 divided by the decimal odds, expressed as a percentage. Decimal odds of 2.50 imply a 40% chance; 4.00 implies 25%. Add all three outcomes and the total exceeds 100%, and that excess is the bookmaker's margin.
A worked example on a 1X2 market:
- Home 2.50 → 40.0%
- Draw 3.40 → 29.4%
- Away 3.00 → 33.3%
- Total = 102.7%, so the margin is 2.7%
Remove the margin by dividing each figure by the total, and you get the market's fair price. If the model says 45% and the market says 40%, the price is short of value, not a guarantee. That is the whole of football betting value explained in one line.
Oddsshopper comparison of betting software and odds coverage
On accuracy, the same rule holds: a 30% forecast should land about 30% of the time. Hit rate flatters; calibration tells the truth.
The hard part is not finding numbers. It is finding numbers you can check after the event. PunditRival publishes model probabilities and fair odds free, freezes them before kick-off, hashes them so they cannot be rewritten, and grades every call in a permanent public archive, losses included. Betting is priced opinion with risk, never a sure thing, and it is for over-18s only. Get started with PunditRival and read the method before you read the odds.
Frequently Asked Questions
What is a football odds analysis tool?
It is any tool that converts bookmaker prices into probabilities or compares prices across books. The main types are odds comparison sites, fair odds calculators, prediction models that publish fair prices, expected-goals sites, and bet-finding scanners. None of them guarantee a win; they help you see whether a price is longer or shorter than your own estimate. PunditRival publishes model probabilities and fair odds free, with every call timestamped and graded publicly.
How do football odds analysis tools calculate probabilities?
The simplest method is implied probability: divide one by the decimal odds. A 2.50 price implies 40%. The three 1X2 prices add up to more than 100%, and the excess is the bookmaker's margin, or overround. Tools either strip that margin out to produce fair odds or use a model, such as a Dixon-Coles goal model, to rate each team's attack and defence and price the match from scratch. PunditRival uses the latter approach and publishes the result as a probability and a fair price.
Can odds analysis tools guarantee a winning bet?
No. No research app or model can guarantee wins. Even the sharpest market is not perfect: in a 10,930-match walk-forward test, PunditRival's 1X2 log loss was 0.9866 against 0.9628 for Pinnacle's closing line, so the bookmaker was more accurate. Treat betting as priced opinion with risk, stake only money you can afford to lose, and keep the bankroll separate from bills and savings. Readers must be 18 or over.
Implied probability of each 1X2 outcome at given decimal odds
